SNMP — one-click PRTG integration
ReadyStackGo ships a ready-made PRTG integration: a bundle (ZIP) with a device template, the MIB and value-lookup files that you unpack into your PRTG install directory. After that, PRTG’s regular Auto-Discovery does the rest — RSGO never needs to know about PRTG, there is no outbound connection and no PRTG credentials in RSGO.
What the bundle gives you
Section titled “What the bundle gives you”| You want… | The bundle delivers |
|---|---|
| To see at a glance whether your stacks are up | A “RSGO: Stacks” sensor table per host, colour-coded (Running green, PartiallyRunning amber, Failed red) |
| To distinguish maintenance from outages | An “Operation Mode” column with state None for maintenance — no red alert during planned windows |
| Per-service checks | A “RSGO: Services” table with Running, HealthStatus and RestartCount columns |
| Symbolic OID names instead of numbers | MIB included; imported via the PRTG MIB Importer |
| Realtime alerts on deployment failures | Combine with the SNMP trap receivers (see the main page, step 8) — after the MIB import PRTG shows rsgoTrapProductDeploymentFailed instead of 65846.1.6.1 |
Step 1: Download the bundle
Section titled “Step 1: Download the bundle”On the SNMP settings page (/settings/snmp) you’ll find a PRTG integration block with a Download PRTG bundle button:
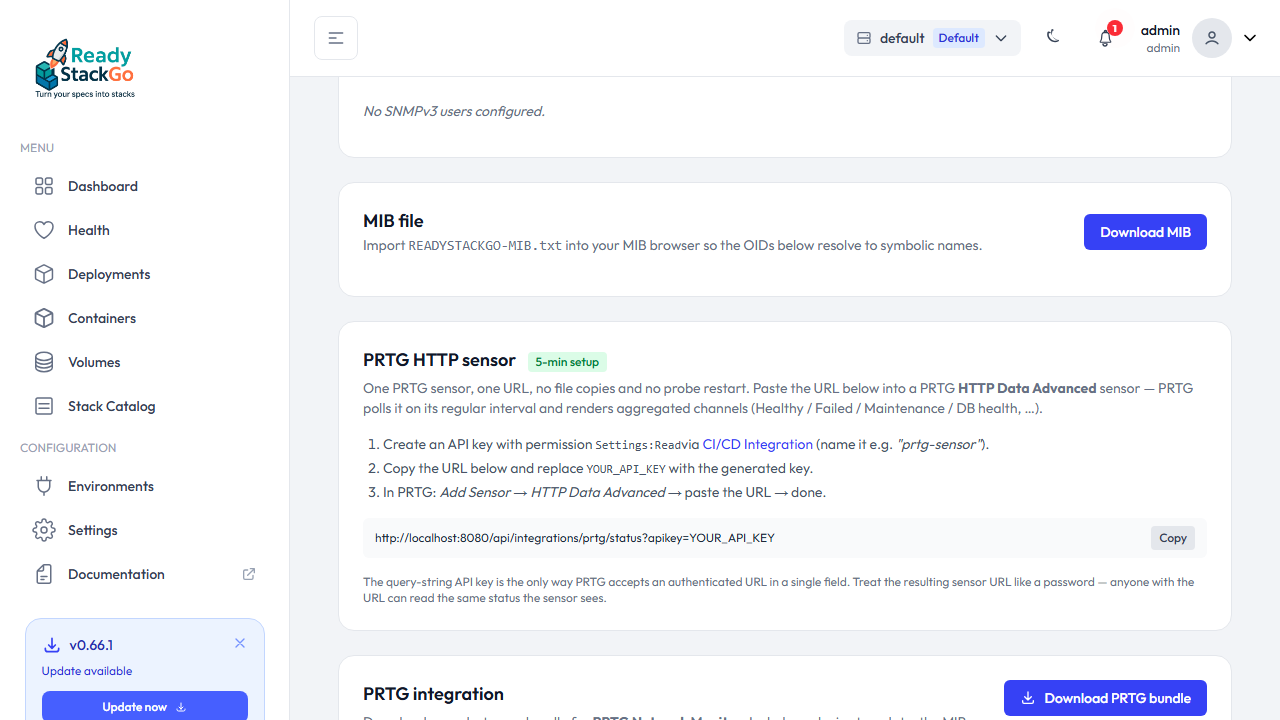
Click it — you get a file like readystackgo-prtg-bundle-0.66.0.zip.
The archive layout mirrors PRTG’s:
readystackgo-prtg-bundle/├── README.txt├── devicetemplates/│ └── readystackgo.template (XML, rooted at your current Root OID)├── snmplibs/│ └── READYSTACKGO-MIB.txt└── lookups/custom/ ├── rsgo.productstatus.ovl ├── rsgo.stackstatus.ovl ├── rsgo.healthstatus.ovl ├── rsgo.environmenttype.ovl ├── rsgo.servicerunning.ovl ├── rsgo.dbhealth.ovl └── rsgo.operationmode.ovlStep 2: Unpack into the PRTG directory
Section titled “Step 2: Unpack into the PRTG directory”Stop the PRTG Probe service (or use “Reload templates” in the PRTG web UI later). Unpack the ZIP into:
C:\Program Files (x86)\PRTG Network Monitor\The archive folders (devicetemplates/, snmplibs/, lookups/custom/) merge with PRTG’s existing folders — existing files are left alone, new files are added.
Step 3: Import the MIB
Section titled “Step 3: Import the MIB”Open the Paessler MIB Importer (in the PRTG install dir):
- File → Import MIB File… →
snmplibs\READYSTACKGO-MIB.txt - File → Save for PRTG (accept the default target folder)
Only after this does PRTG translate OIDs into symbolic names.
Step 4: Start the probe + Auto-Discovery
Section titled “Step 4: Start the probe + Auto-Discovery”- Start the PRTG Probe service again.
- In the PRTG web UI open the Device for your ReadyStackGo host.
- Set an SNMP credential on the device (community for v2c, USM user for v3 — matching what you configured in RSGO).
- Right-click → Run Auto-Discovery (with template).
- In the wizard pick ReadyStackGo Deployment.
After a few seconds the new sensors appear:
- RSGO: System Version / Build Timestamp
- RSGO: DB Health, Environment Count, Source Count
- RSGO: Environments, Product Deployments, Stacks, Services (table sensors with status + counts)
The default polling interval is 60 seconds — adjust per sensor if you want finer granularity.
What the lookups do
Section titled “What the lookups do”The .ovl files in the bundle translate integer status values into both text and sensor state:
| File | Example mapping |
|---|---|
rsgo.productstatus.ovl | 1=Running:Ok, 2=PartiallyRunning:Warning, 4=Failed:Error, 6=Removed:None |
rsgo.stackstatus.ovl | analogous for StackDeploymentStatus |
rsgo.healthstatus.ovl | 0=Healthy:Ok, 2=Unhealthy:Error, 3=Unknown:Ok |
rsgo.operationmode.ovl | 0=Normal:Ok, 1=Maintenance:None |
rsgo.servicerunning.ovl | 0=stopped:Error, 1=running:Ok |
rsgo.environmenttype.ovl | DockerSocket / DockerTcp / DockerAgent / SshTunnel |
rsgo.dbhealth.ovl | 0=unknown:Warning, 1=ok:Ok, 2=fail:Error |
The second value per entry (Ok / Warning / Error / None) is the PRTG sensor state — sensors light up red/amber/green automatically, no manual thresholds.
Updates
Section titled “Updates”When the OID layout changes, when an enum gets a new value, or when you change your Root OID: re-download the bundle and unpack it again (only rsgo.* files are overwritten). Existing sensors keep working; new columns become available on the next discovery pass.
Troubleshooting
Section titled “Troubleshooting”| Symptom | Cause | Fix |
|---|---|---|
| Sensors show “No such name” | OID path in the template does not match the agent | Verify the Root OID in RSGO, re-download the bundle |
Status shown as a number (4 instead of Failed) | Lookups were not loaded | Check lookups/custom/ in the PRTG install dir, restart the probe |
| Table sensors show 0 rows | SNMP credential on the PRTG device is missing or wrong | In PRTG: Device → Settings → SNMP Credentials; “Test Sensor” |
| Trap sensor receives nothing | Trap receiver not set in RSGO or firewall blocks UDP/162 | RSGO settings → Trap receivers; ss -ulpn | grep 162 on the PRTG host |
Related pages
Section titled “Related pages”- Set up SNMP in ReadyStackGo — base configuration of the agent
- Security models — v2c vs. v3 (PRTG supports both)
- Auth and priv algorithms — what to pick for the PRTG credential