SNMP — PRTG HTTP sensor (5-minute setup)
ReadyStackGo exposes one endpoint in the PRTG “HTTP Data Advanced” JSON schema: you add a single sensor in PRTG, paste a URL, and PRTG polls RSGO directly. No Program-Files writes, no probe restart, no MIB import.
What you get
Section titled “What you get”One PRTG sensor with ~13 channels (all globally aggregated across environments):
| Channel | Meaning | Sensor state when value > 0 |
|---|---|---|
| Products total | Active ProductDeployments (excludes Removed/Superseded) | — |
| Products healthy | Status = Running | — |
| Products degraded | Status = PartiallyRunning | Warning |
| Products failed | Status = Failed | Error |
| Products in maintenance | OperationMode = Maintenance | — (no alarm during planned downtime) |
| Stacks total / running / failed | Per-stack aggregation | Stacks failed → Error |
| Services running / not running | Container run state | Services not running → Error |
| Environments | Number of environments in RSGO | — |
| DB health | DB probe (1 = ok via the built-in PRTG standard lookup) | — |
| Uptime | RSGO container uptime in seconds | — |
Plus a status text below the sensor listing the problematic products (e.g. ams.tooling FAILED · ams.project in maintenance).
Setup in 3 steps
Section titled “Setup in 3 steps”Step 1: create an API key in RSGO
Section titled “Step 1: create an API key in RSGO”Open Settings → CI/CD Integration and create a new key:
- Name:
prtg-sensor(or similar — easy to recognise in the logs) - Permissions: only
Settings:Read— the PRTG sensor only reads status, never writes - Environment scope: optional, if you want to expose a single environment
Copy the one-time-shown key (format rsgo_...).
Step 2: copy the URL from the SNMP settings page
Section titled “Step 2: copy the URL from the SNMP settings page”On Settings → SNMP Monitoring there is a card “PRTG HTTP sensor” with the full URL:
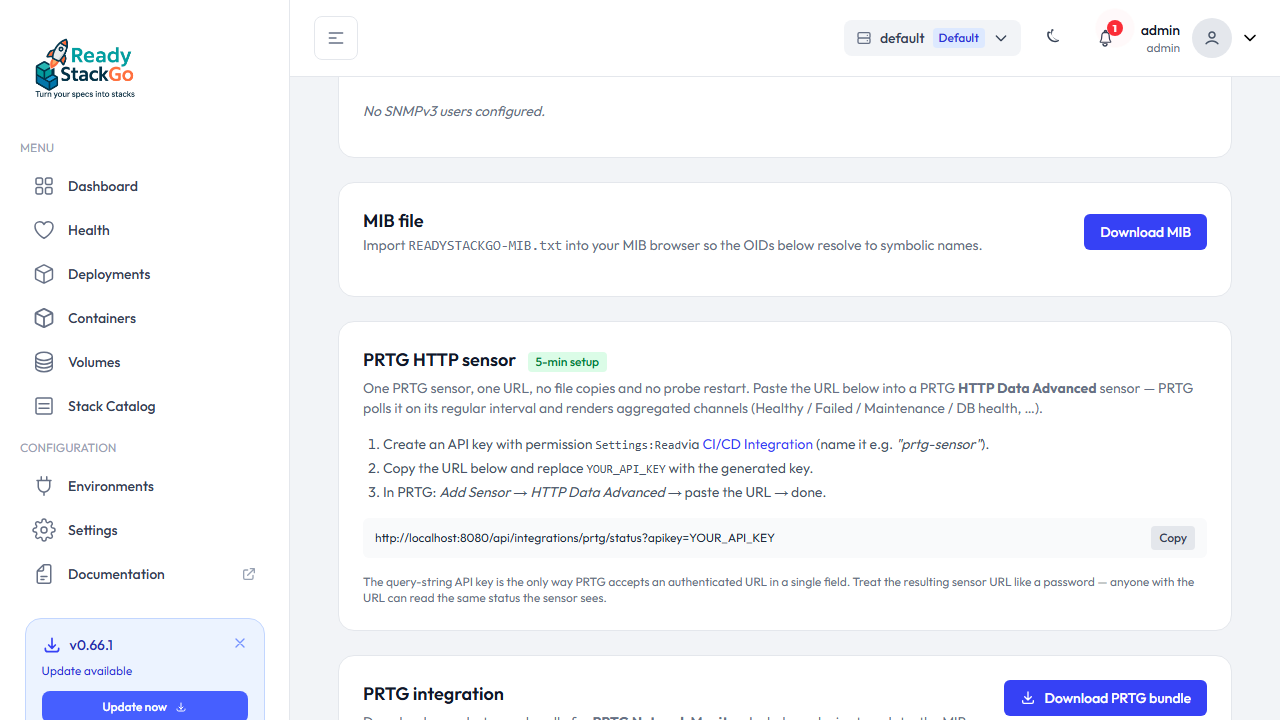
https://rsgo.example.local/api/integrations/prtg/status?apikey=YOUR_API_KEYReplace YOUR_API_KEY with the key from step 1.
Step 3: create the sensor in PRTG
Section titled “Step 3: create the sensor in PRTG”- In the PRTG web UI: open the Device (or create one) → Add Sensor.
- Search “HTTP Data Advanced” → pick the sensor type.
- In the URL field, paste the URL you built in step 2.
- Leave the Interval at 60 s (the RSGO endpoint caches internally for 30 s — polling more often gives no extra data).
- OK → sensor is live.
Within ~60 s every channel shows a value. If one turns red (Failed/Stack-down/Service-down), the PRTG sensor text in the overview tells you which product is the problem.
Security & API key in the URL
Section titled “Security & API key in the URL”Important: PRTG’s HTTP Data Advanced sensor cannot send HTTP headers — the API key has to live in the URL. Two consequences:
- The sensor URL is a secret — anyone who has it can read the same status the sensor sees. Treat it like a password.
- PRTG logs URLs by default (sensor logs, debug data). If that is a concern:
- Rotate the API key regularly (in RSGO
/settings/cicd→ revoke → recreate). - Or switch to Variant 1 (Device Template), which uses SNMP auth only.
- Rotate the API key regularly (in RSGO
The endpoint itself is read-only (no secrets in the response, no mutations) — the impact of a leaked sensor URL is read access to data that’s already on the dashboard.
JSON format (reference)
Section titled “JSON format (reference)”If you hit the endpoint yourself (e.g. with curl):
curl -H "X-Api-Key: rsgo_..." https://rsgo.example.local/api/integrations/prtg/status | jqThe response is exactly the format Paessler documents in Custom Sensors via JSON:
{ "prtg": { "result": [ { "channel": "Products total", "value": "5", "unit": "Count" }, { "channel": "Products healthy", "value": "4", "unit": "Count" }, { "channel": "Products failed", "value": "1", "unit": "Count", "limitmaxerror": 0, "limitmode": 1 }, { "channel": "Products in maintenance", "value": "0", "unit": "Count" }, { "channel": "DB health", "value": "1", "unit": "Custom", "customunit": "state", "ValueLookup": "prtg.standardlookups.yesno.stateyesok" }, { "channel": "Uptime", "value": "123456", "unit": "TimeSeconds" } ], "text": "ams.tooling FAILED" }}Auth via header (alternative)
Section titled “Auth via header (alternative)”If you call the endpoint from a custom-script sensor variant (or another tool like Checkmk that can send headers), use the X-Api-Key header instead of the query string:
curl -H "X-Api-Key: rsgo_..." https://rsgo.example.local/api/integrations/prtg/statusBoth paths return the same response. Header is the preferred path — the query string exists only because PRTG’s stock HTTP sensor cannot inject headers.
Troubleshooting
Section titled “Troubleshooting”| Symptom | Cause | Fix |
|---|---|---|
| Sensor shows “401 Unauthorized” | API key missing or wrong permission | Re-check the key; make sure Settings:Read is in its permission set |
| Sensor shows “404 Not Found” | Wrong URL (typo in the path) | Re-copy the URL from the RSGO UI — the path is /api/integrations/prtg/status |
| All channels are 0 | No active ProductDeployments | Check the RSGO dashboard for running deployments |
| Sensor goes red, but nothing is broken | A stack was manually stopped — “Stacks failed” counts every non-Running as failed | Restart the stack, or set Maintenance mode (no longer counts as failure) |
| Sensor stays empty in the first minute | Cold snapshot cache (30 s, built lazily) | Wait up to 60 s |
Related pages
Section titled “Related pages”- Set up SNMP in ReadyStackGo — base configuration of the agent
- PRTG Device Template Bundle (Variant 1) — deep integration with per-stack sensors
- SNMP basics — what SNMP actually is