Health Monitoring
ReadyStackGo continuously monitors the health of all deployed stacks. The Health Dashboard displays the current status of all services in real-time, automatically detects problems, and provides a detailed timeline with status transitions.
Overview
Section titled “Overview”| Feature | Description |
|---|---|
| Health Dashboard | Overview of all stacks with status filters and search |
| Summary Cards | Quick overview: Healthy, Degraded, Unhealthy, Total |
| Stack Cards | Expandable cards per stack with service details |
| Health History | Uptime donut chart and color-coded status timeline |
| Per-Service Timeline | Swim lane diagram for each individual service |
| Service Detail | Detailed view with health check entries and response times |
| Maintenance Mode | Planned maintenance windows visually distinguished |
| Real-Time Updates | Live connection via SignalR for immediate status changes |
Step by Step: Health Dashboard
Section titled “Step by Step: Health Dashboard”Step 1: Open the Dashboard
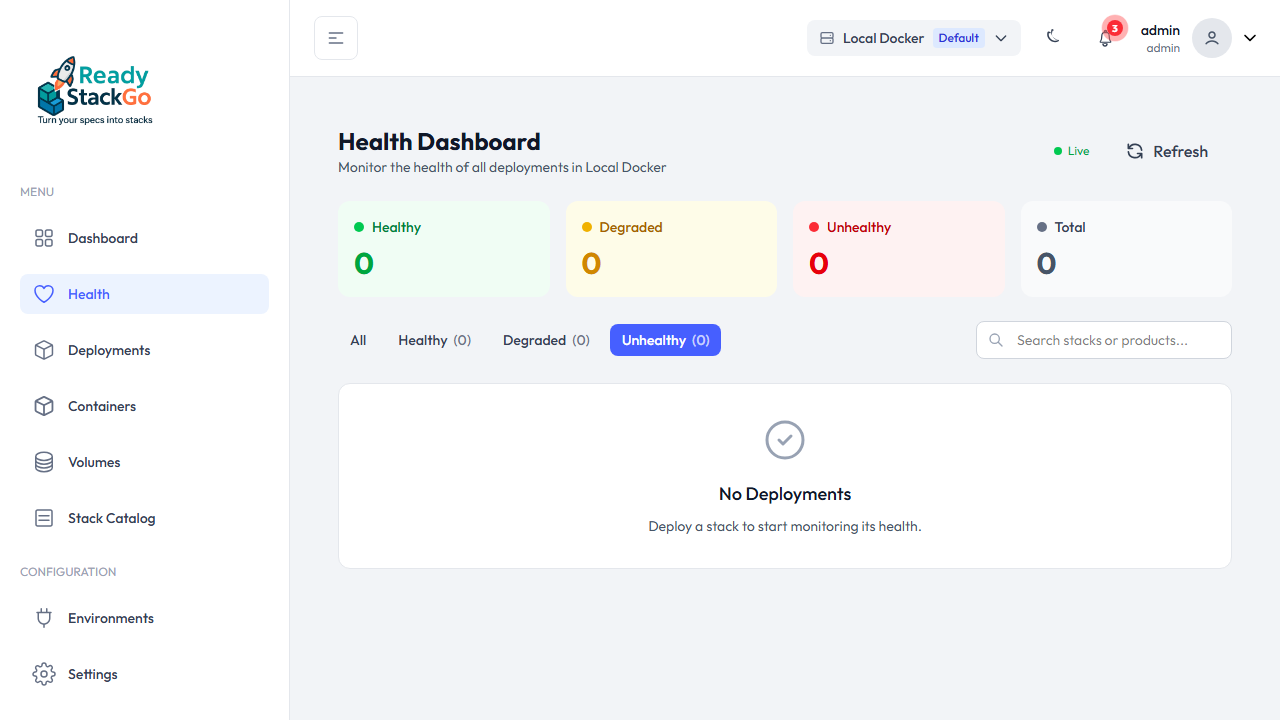
Section titled “Step 1: Open the Dashboard”Navigate to Health in the sidebar. The dashboard shows an overview of all deployments in the active environment.

Step 2: Read Summary Cards
Section titled “Step 2: Read Summary Cards”The four summary cards at the top provide an at-a-glance overview:
- Healthy (green) — Number of stacks where all services are running
- Degraded (yellow) — Stacks with partial issues
- Unhealthy (red) — Stacks with critical problems
- Total — Total number of monitored stacks

Step 3: Expand Stack Details
Section titled “Step 3: Expand Stack Details”Click on a stack card to view its individual services. Each service shows:
- Name and container name
- Status as a colored badge (Healthy/Degraded/Unhealthy)
- Response Time for HTTP health checks
- Restart Count when issues occur

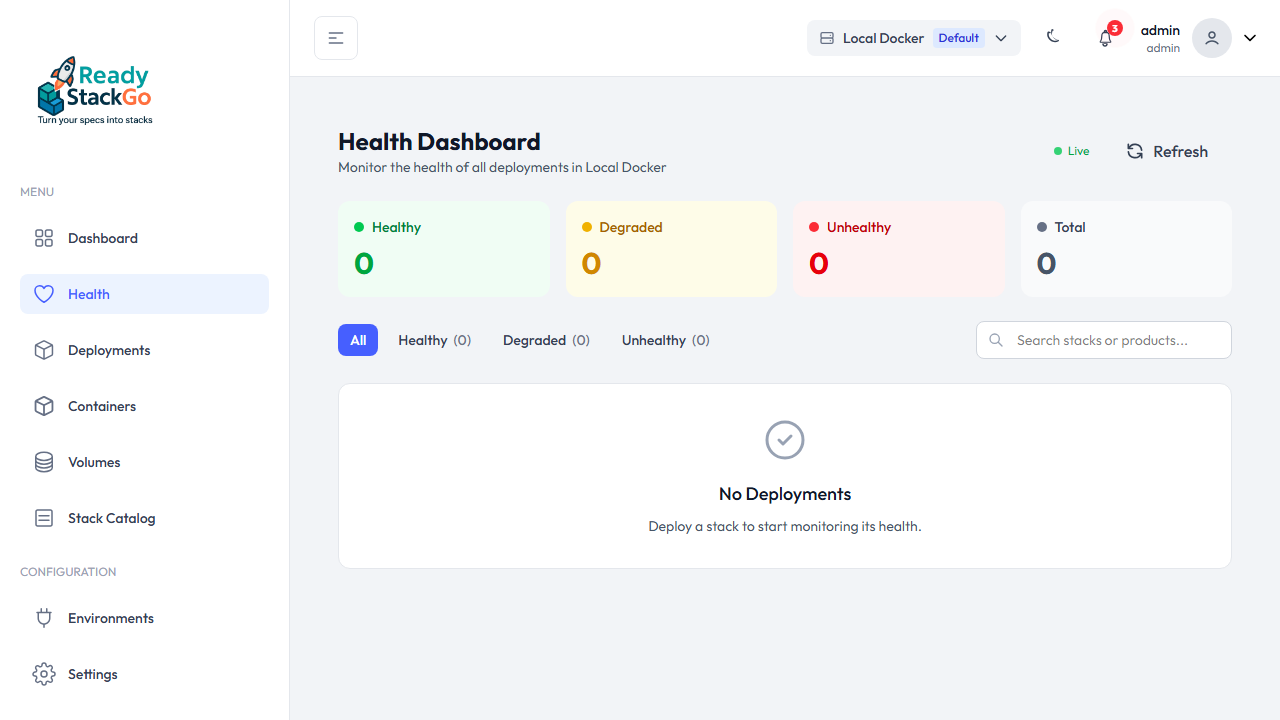
Step 4: Filter by Status
Section titled “Step 4: Filter by Status”Use the status filter buttons to display only stacks with a specific status:
- All — Show all stacks
- Healthy — Only healthy stacks
- Degraded — Only degraded stacks
- Unhealthy — Only problematic stacks
Step 5: Search Stacks
Section titled “Step 5: Search Stacks”The search field filters stacks in real-time by name. Type a stack name to quickly find a specific deployment.
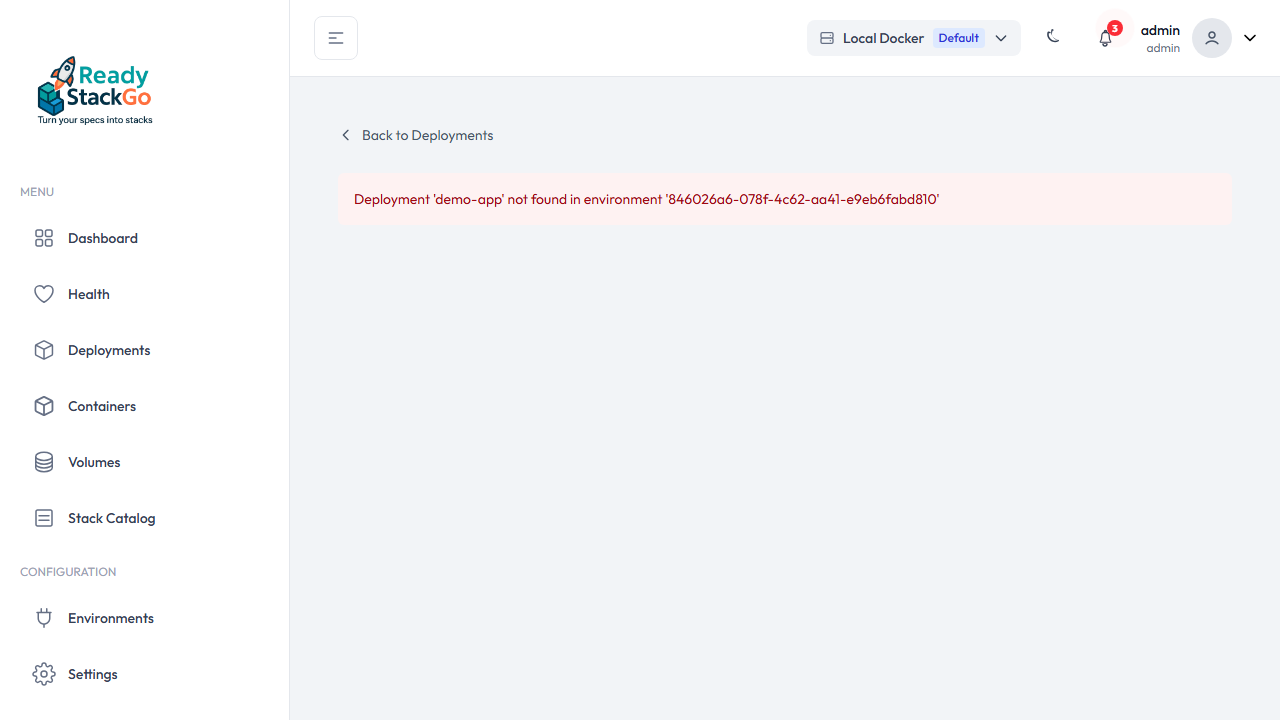
Deployment Detail & Health History
Section titled “Deployment Detail & Health History”The deployment detail page provides comprehensive health information:
Health Summary
Section titled “Health Summary”The summary card shows the current status at a glance: number of healthy services, operation mode, and status message.
Health History Timeline
Section titled “Health History Timeline”The Health History shows the status over time for the entire deployment:
- Uptime Donut (left) — Percentage distribution of operating time by status
- Status Band — Color-coded timeline: Green = Healthy, Yellow = Degraded, Red = Unhealthy, Blue = Maintenance
- Per-Service Swim Lanes — Individual timeline per service (only shown for multi-service stacks)
- Tooltip — Hover over the timeline to see details: timestamp, status, and the state of each individual service

Services List
Section titled “Services List”Below the Health History, you’ll see the current list of all services with their status, response time, and restart count.

Maintenance Mode
Section titled “Maintenance Mode”ReadyStackGo distinguishes between planned maintenance windows and real problems:
- Enter Maintenance — Button on the deployment detail page, stops containers as planned
- Exit Maintenance — Restarts containers and returns to normal operation
- Visual Distinction — Maintenance periods are displayed in blue in the timeline
- Uptime Calculation — Maintenance time is shown separately and does not negatively affect the uptime percentage
Real-Time Updates
Section titled “Real-Time Updates”The Health Dashboard uses SignalR for real-time updates:
- Live (green dot) — Connection active, updates displayed immediately
- Connecting… (yellow dot) — Connection is being established
- Offline (gray dot) — No connection, manual refresh via the Refresh button
Health checks are performed every 30 seconds by default. Status changes trigger an immediate notification.
Health Check Configuration
Section titled “Health Check Configuration”Services can configure HTTP health checks via Docker labels:
services: api: image: myapp/api:latest labels: rsgo.healthcheck.path: /hc rsgo.healthcheck.port: "8080"| Label | Description |
|---|---|
rsgo.healthcheck.path | HTTP path for the health check (e.g., /hc, /health) |
rsgo.healthcheck.port | Port for the health check (must be exposed) |
Services without health check labels are monitored via Docker container status (Running/Stopped/Restarting).
Services with health check labels receive additional HTTP-based checks and can provide detailed health check entries (e.g., database connectivity, disk space, external services).